
How Ultra-Processed Foods Differ From Processed Foods — and Why the Distinction Matters

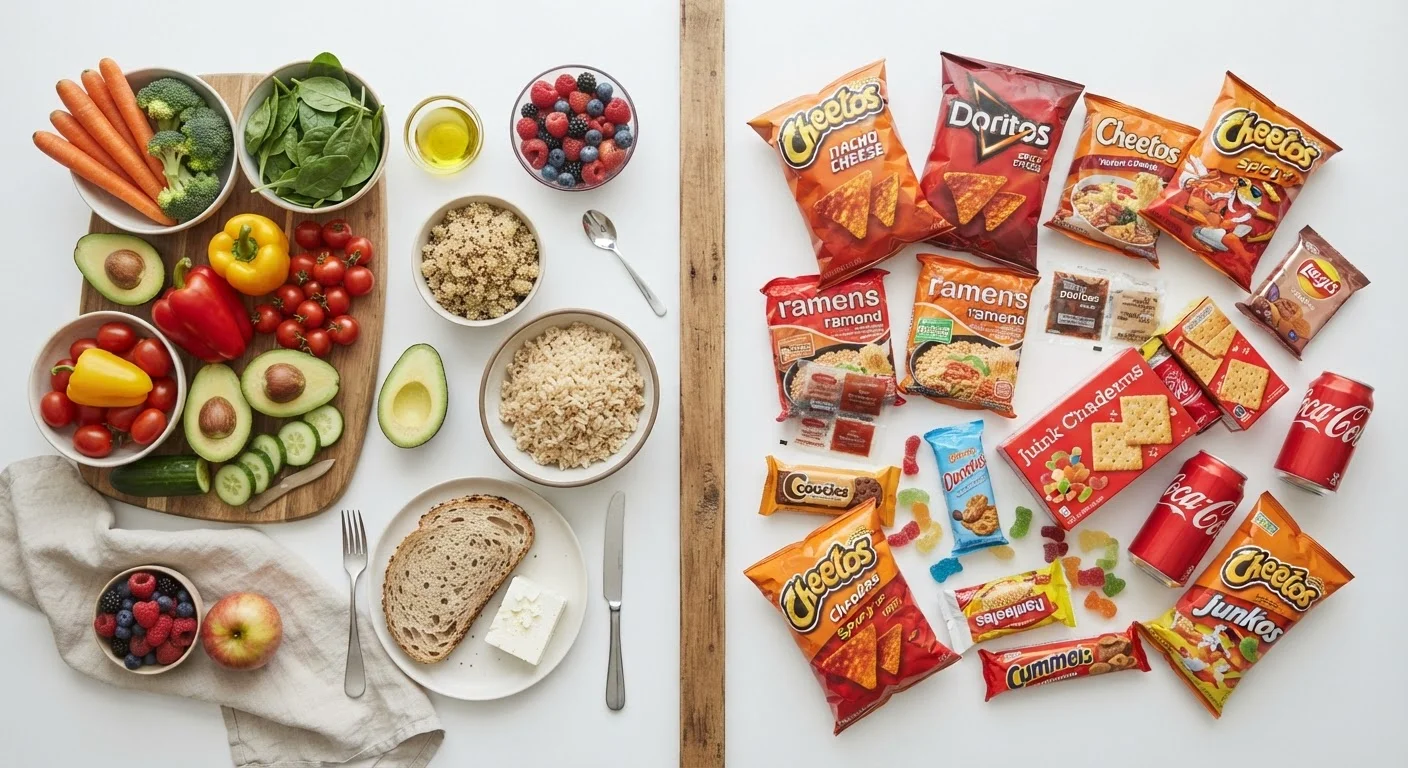
Key Takeaways
- The NOVA classification system divides foods into four groups based on the extent and purpose of processing, not just ingredient count.
- Ultra-processed foods contain industrial additives not typically found in home kitchens, distinguishing them from minimally processed foods.
- Observational research consistently links high ultra-processed food consumption with elevated risk of chronic disease.
- Processed foods like canned vegetables or plain yogurt can still be nutritious and convenient choices.
- Reducing ultra-processed food intake does not require perfection — incremental swaps make a measurable difference.
Our Verdict
The core distinction lies in industrial formulation: ultra-processed foods are engineered with additives, flavor compounds, and texturizing agents rarely used in home cooking, whereas minimally processed foods retain most of their original nutritional structure. Nutrition research suggests limiting ultra-processed foods is a meaningful, evidence-backed goal, while minimally and moderately processed foods can remain part of a balanced diet.
| Best for | Recommended |
|---|---|
| Readers wanting a quick daily framework | NOVA Group 1 & 2 foods (minimally processed and culinary ingredients) |
| Busy households needing convenience without sacrificing nutrition | NOVA Group 3 processed foods (e.g., canned legumes, cheese, plain yogurt) |
| Those aiming to reduce chronic disease risk through diet | Actively minimizing NOVA Group 4 ultra-processed foods |
The NOVA Framework: A New Way to Classify Food
Most people think of "processed food" as anything that comes in a package. But that broad label conflates canned chickpeas with cheese-flavored snack puffs — two products that share very little nutritionally or functionally. The NOVA classification system, developed by researchers at the University of São Paulo, offers a more precise framework by grouping foods according to the extent and purpose of processing rather than nutrient content alone.
NOVA defines four groups:
- Group 1 — Minimally processed foods: Whole or near-whole foods altered only by drying, freezing, pasteurizing, or fermenting. Examples include fresh fruit, plain frozen vegetables, unsalted nuts, and plain oats.
- Group 2 — Culinary ingredients: Substances extracted from Group 1 foods and used in cooking — oils, flours, sugar, salt, and vinegar.
- Group 3 — Processed foods: Products made by combining Group 1 and Group 2 items, often with preservation as the goal. Canned fish in oil, natural cheeses, cured meats, and plain bread fit here.
- Group 4 — Ultra-processed foods: Industrial formulations containing ingredients rarely or never used in home kitchens, including emulsifiers, artificial flavors, modified starches, color additives, and preservatives engineered for palatability and shelf stability.
Understanding where a food sits in this system is more instructive than scanning for a single "bad" nutrient. For a complementary skill, see our guide on reading a nutrition label without getting lost in the numbers.
What Actually Makes a Food Ultra-Processed
The key differentiator for Group 4 foods is the presence of industrial additives whose primary purpose is to make a product hyper-palatable, visually appealing, or shelf-stable — not to preserve or cook food in the traditional sense. Common markers include:
- Hydrolyzed proteins and flavor enhancers (e.g., monosodium glutamate analogs)
- Modified starches and maltodextrin used as bulking or texturizing agents
- Emulsifiers such as carrageenan or polysorbates that create smooth, uniform textures
- Artificial or "nature-identical" flavor compounds listed as "natural flavors"
- Color additives (e.g., Red 40, Yellow 5) that have no nutritional function
These ingredients are absent from a jar of plain peanut butter (ingredients: peanuts, salt) but present in a peanut-flavored snack cracker with 20-plus ingredients. The distinction matters because ultra-processed formulations are specifically engineered to override normal satiety signals, according to researchers studying food reward pathways.
| NOVA Group 1 (Minimally Processed) | NOVA Group 3 (Processed) | NOVA Group 4 (Ultra-Processed) | |
|---|---|---|---|
| Examples | Fresh vegetables, plain oats, eggs | Canned beans, natural cheese, plain bread | Packaged snacks, flavored chips, instant noodles |
| Industrial additives present | None | Minimal (salt, vinegar) | Many (emulsifiers, flavors, colorants) |
| Nutrient retention | High | Moderate | Often low relative to calories |
| Typical fiber content | Naturally high | Variable | Generally low |
| Satiety signaling | Strong | Moderate | Potentially blunted by formulation |
| Research-linked disease risk | Associated with lower risk | Neutral to low risk | Associated with elevated risk |
It's also worth noting that marketing language like "natural," "wholesome," or "made with real ingredients" does not disqualify a product from being ultra-processed — always check the ingredient list, not just the front of package claims. Our deep-dive on nutrition myths that refuse to die addresses several related misconceptions.
What the Research Says About Ultra-Processed Consumption
A growing body of large-scale epidemiological research associates high ultra-processed food intake with elevated risks of obesity, type 2 diabetes, cardiovascular disease, and certain cancers. A landmark 2019 randomized controlled trial published in Cell Metabolism found that participants assigned an ultra-processed diet consumed significantly more calories and gained weight compared to those on a minimally processed diet — even when both diets were matched for offered calories, sugar, fat, and fiber.
57%
Share of US calories from ultra-processed foods
A nationally representative dietary recall study published in BMJ Open estimated that ultra-processed foods account for roughly 57% of daily caloric intake among US adults.
500 kcal/day
Extra calories consumed on ultra-processed diet
In the 2019 Cell Metabolism randomized controlled trial, participants on an ultra-processed diet consumed approximately 500 more calories per day than those on a minimally processed diet.
Researchers hypothesize several mechanisms: displacement of fiber-rich whole foods, disruption of gut microbiome diversity, faster eating rates driven by soft textures, and additive-driven palatability that overrides satiety cues. These are active areas of research, and causation is not fully established — observational studies cannot rule out confounding lifestyle factors. Still, the consistency of associations across multiple populations and study designs has led major nutrition bodies to recommend reducing ultra-processed food intake as a general population health strategy.
For context on how grain processing alone changes nutritional value, see our article on whole grains vs. refined grains.
A Practical Starting Point: The Ingredient List Test
If an ingredient list contains substances you would not typically find in a home kitchen — such as modified corn starch, polysorbate 80, or artificial flavor compounds — the product likely falls into the ultra-processed category. You do not need to eliminate all such foods at once. Replacing one ultra-processed item per day with a Group 1 or Group 3 alternative is a sustainable, evidence-aligned approach to improving diet quality over time.
This article is for general informational and educational purposes only and is not a substitute for professional medical or dietary advice. Consult a qualified healthcare provider or registered dietitian before making significant changes to your diet.